Santa Barbara, California
City of Santa Barbara June 2025 Annual Water Quality Report (2024 data). Hardness prints as three labeled sources — surface 426 ppm (368–496) / 21–29 gpg, groundwater 560 ppm / 32–33 gpg, desal 54.2 ppm (45.7–76.2) / 2.5–4.5 gpg. Chlorine as Cl2 0.82 mg/L average. No Measure S-style residential softener ban ordinance opened — check the sewer agency on the bill.
- Hardness (surface)426 mg/L (range 368–496)
- Hardness (groundwater)560 mg/L / 32–33 gpg
- Hardness (desal)54.2 mg/L (range 45.7–76.2)
- Chlorine0.82 mg/L avg (range ND–1.81)
Best match for Santa Barbara
Salt-based water softener — confirm the district first
Check the sanitation district before installing a salt system.
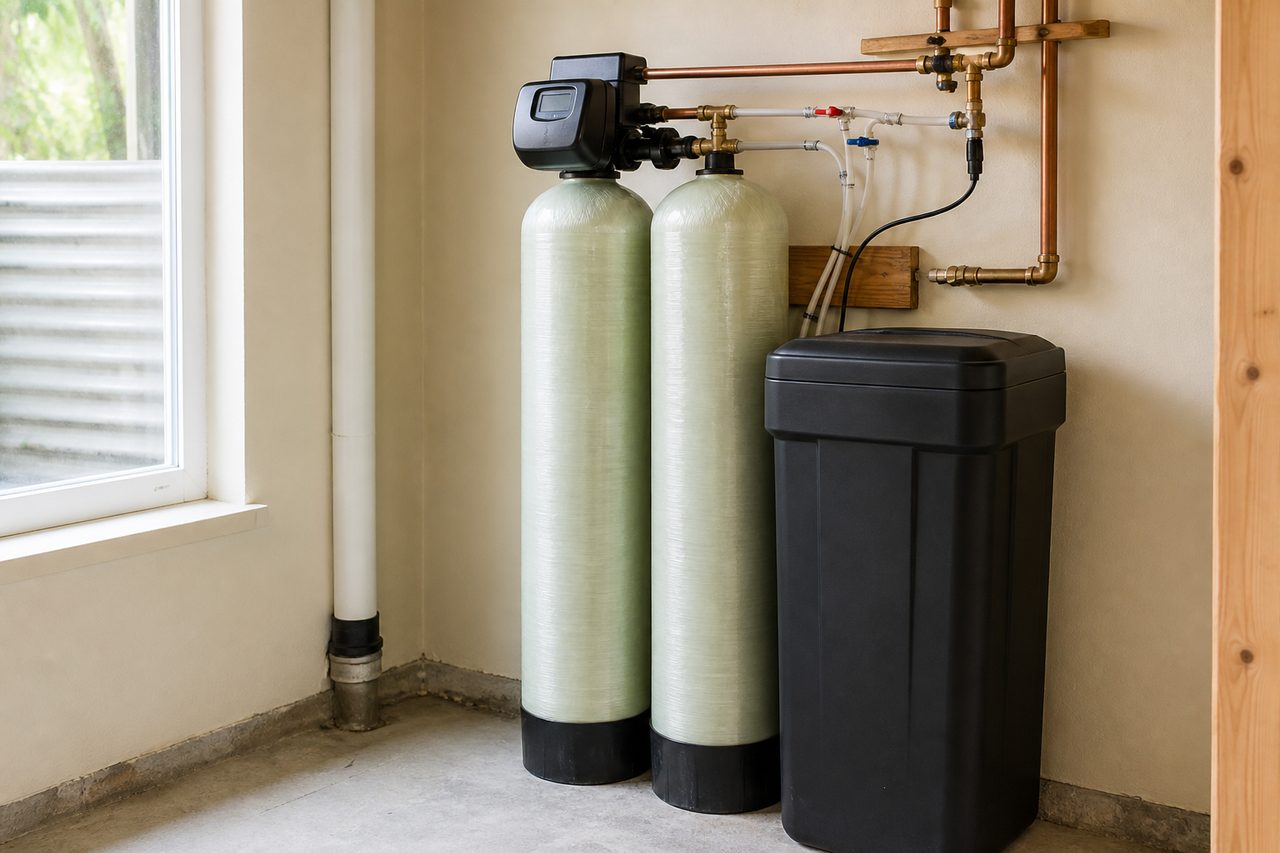
Ask the agency on the sewer side of the bill before you cut a brine drain. California lets districts restrict self-regenerating units. A “banned in California” blog is not your district.
Some links are affiliate links. If you buy through one, we may earn a commission. That does not change the match, and it is not a medical claim.
As an Amazon Associate we earn from qualifying purchases.
Other options that still fit
Salt-free conditioner
A salt-free conditioner changes how scale sticks. It does not soften. Soap and spots stay closer to untreated. No brine line.
Whole-house carbon for chlorine
That is chlorine. A whole-house carbon filter with an NSF/ANSI 42 chlorine claim is the usual match. A softener will not take chlorine out.
Under-sink reverse osmosis
The under-sink RO we actually run is Cloud RO — NSF/ANSI 58, kitchen tap, not a whole-house tank. Check the exact listing if PFAS is why you are shopping. Shop Amazon first for under-sink RO, or buy Cloud direct. Waterdrop is a tankless option if you want that path. A certifier-listed pitcher is the cheap first step. Nobody is paying for a medical claim.
Shop under-sink reverse osmosisBuy Cloud RO directShop Waterdrop reverse osmosisShop PFAS-listed pitchers
Test the tap first
A homeowner kit is a start. It is not a state-certified lab. Use a certified lab when the decision is expensive.
On the report
- Water utility
- City of Santa Barbara Water Resources
- Hardness
- Total hardness as CaCO3 — surface-water column 426 mg/L (range 368–496); groundwater column 560 mg/L; desalinated-water column 54.2 mg/L (range 45.7–76.2). The same report’s recommended-softener-settings box prints groundwater 32–33 gpg, surface water 21–29 gpg, desal water 2.5–4.5 gpg (1 grain/gallon = 17.1 mg/L). Those are labeled source columns, not a blended citywide number. 2025 Annual Water Quality Report (2024 data). — City of Santa Barbara 2025 Annual Water Quality Report (2024 data)
- Disinfectant
- Disinfectant — chlorine as Cl2 system-wide average 0.82 mg/L (range ND–1.81). MRDL 4.0. Drinking water disinfectant added for treatment. 2025 report (2024 data). — City of Santa Barbara 2025 Annual Water Quality Report (2024 data)
- Brine / salt to the sewer
- Check the sanitation district before installing. No City of Santa Barbara residential self-regenerating softener ban like LACSD Measure S turned up. That is not a statewide ban finding. Ask the sewer agency on the bill before you cut a brine drain.
Also around here
Extra context besides the utility report and the chart above — geology, an unregulated table, or a published study. Not a second set of printed tap numbers.
- MicroplasticsWHO’s 2019 review examined studies that found microplastic particles in treated tap and bottled water in many places. That is a published-occurrence finding, not a number from this city’s water-quality report, and we do not invent a particles-per-liter count for the tap.Microplastics in drinking-water — World Health Organization
- Other 2024 table numbersThe same 2025 report prints these as labeled surface / groundwater / desal or system-wide results, not a blend we invented.TTHMs highest LRAA 34 µg/L (range 3.2–47). HAA5 highest LRAA 16.8 µg/L (range 0.44–21). PFAS not detected on the 2024 source samples the report describes.2025 Annual Water Quality Report — City of Santa Barbara Water Resources
Santa Barbara drinking water is treated at the Cater plant (Gibraltar and Cachuma), the Charles E. Meyer Desalination Plant, and groundwater plants. No City of Santa Barbara residential softener ban like LACSD Measure S turned up. Ask the sewer agency on the bill before you cut a brine drain. This is not a legal opinion and not a statewide ban.
The 2025 Annual Water Quality Report prints hardness as three labeled sources — surface 426 mg/L (range 368–496), groundwater 560 mg/L, desal 54.2 mg/L (range 45.7–76.2). The recommended-settings box prints 21–29 / 32–33 / 2.5–4.5 gpg. We do not invent a citywide blend.
Chlorine as Cl2 0.82 mg/L system-wide average (range ND–1.81). Kitchen shopping stays the Cloud RO / Waterdrop path already used on other cities if a listing is why you are looking.
Sources
- 2025 Annual Water Quality Report — City of Santa Barbara Water Resources. Accessed 2026-09-09.
Updated September 9, 2026. A city file is chemistry we can cite plus the sewer rule. No invented detections.