Washington, District of Columbia
DC Water 2025 Drinking Water Quality Report (2024 data). Washington Aqueduct treats Potomac River water; residual disinfectant is chloramine most of the year. Total hardness 126 ppm (range 78–175). No Measure S-style residential softener ban turned up.
- Hardness126 ppm / 7 gpg (range 78–175)
- Chlorine (chloramine)3.2 ppm RAA (range 0.1–4.2)
- TTHMs55 ppb LRAA (range 22–68)
- HAA535 ppb LRAA (range 13–55)
Best match for Washington
Salt-based water softener
No district prohibition on a brine drain turned up in the current file.
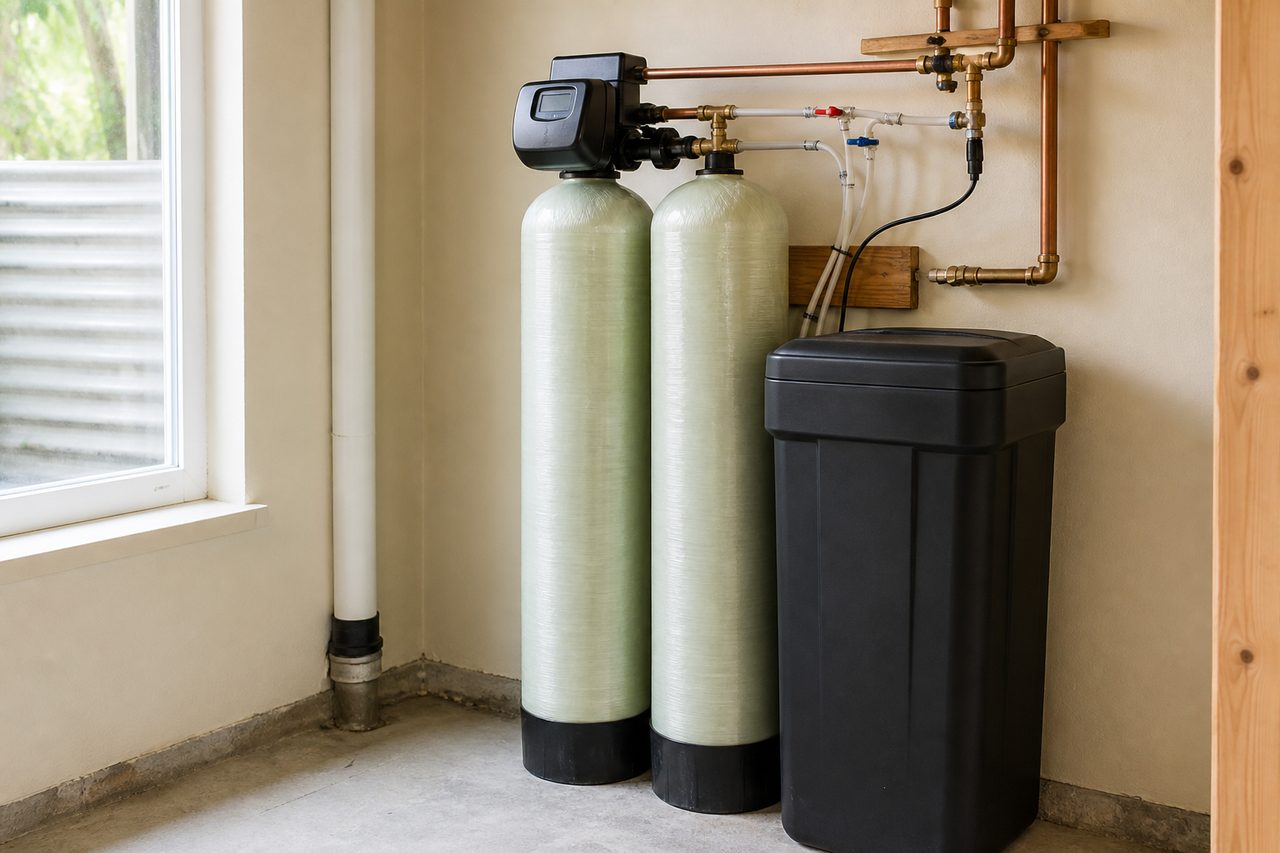
A salt-based softener is the thing that actually removes hardness. Size it from your grains and how much water you use, not bathroom count. It needs a drain.
Some links are affiliate links. If you buy through one, we may earn a commission. That does not change the match, and it is not a medical claim.
As an Amazon Associate we earn from qualifying purchases.
Other options that still fit
Salt-free conditioner
A salt-free conditioner changes how scale sticks. It does not soften. Soap and spots stay closer to untreated. No brine line.
Whole-house catalytic carbon for chloramine
Catalytic carbon with a chloramine claim (NSF/ANSI 42 for chloramine). Regular chlorine carbon is the wrong box.
Under-sink reverse osmosis
The under-sink RO we actually run is Cloud RO — NSF/ANSI 58, kitchen tap, not a whole-house tank. Check the exact listing if PFAS is why you are shopping. Shop Amazon first for under-sink RO, or buy Cloud direct. Waterdrop is a tankless option if you want that path. A certifier-listed pitcher is the cheap first step. Nobody is paying for a medical claim.
Shop under-sink reverse osmosisBuy Cloud RO directShop Waterdrop reverse osmosisShop PFAS-listed pitchers
Test the tap first
A homeowner kit is a start. It is not a state-certified lab. Use a certified lab when the decision is expensive.
On the report
- Water utility
- DC Water / Washington Aqueduct
- Hardness
- Total hardness 126 ppm as CaCO3 (range 78–175), also printed as 7 grains/gal (range 5–10). One printed row on the 2025 report (2024 data), not two plant columns we blended. — DC Water 2025 Drinking Water Quality Report (2024 data)
- Disinfectant
- Chloramine most of the year (chlorine plus ammonia). Chlorine highest running annual average 3.2 ppm (range of single-site annual results 0.1–4.2), MRDL 4. The booklet says the Aqueduct switches to free chlorine for a short period each spring. — DC Water 2025 Drinking Water Quality Report (2024 data)
- Brine / salt to the sewer
- No district prohibition found in current research. No District of Columbia or DC Water residential softener ban like LACSD Measure S turned up. Ask DC Water or the agency on the sewer bill before you cut a brine drain.
Also around here
Extra context besides the utility report and the chart above — geology, an unregulated table, or a published study. Not a second set of printed tap numbers.
- MicroplasticsWHO’s 2019 review examined studies that found microplastic particles in treated tap and bottled water in many places. That is a published-occurrence finding, not a number from this city’s water-quality report, and we do not invent a particles-per-liter count for the tap.Microplastics in drinking-water — World Health Organization
- PFASThe 2025 report prints a PFAS table. Those are labeled results, not a city tap average we invented.PFOA 0.3 ppt average (ND–2.0). PFOS 1.7 ppt average (ND–2.4). EPA MCL 4.0 ppt each, effective 2029.2025 Drinking Water Quality Report (2024 data) — DC Water
Washington drinking water is treated by the Washington Aqueduct (U.S. Army Corps of Engineers) from the Potomac River and delivered by DC Water. No District of Columbia or DC Water residential softener ban like LACSD Measure S turned up. Ask DC Water or the agency on the sewer bill before you cut a brine drain. This is not a legal opinion.
The 2025 Drinking Water Quality Report (2024 data) prints total hardness 126 ppm as CaCO3 (range 78–175), also 7 grains/gal (range 5–10). We do not invent a second plant column.
Residual disinfectant is chloramine most of the year. Chlorine highest running annual average 3.2 ppm (range of single-site annual results 0.1–4.2). The booklet says the Aqueduct switches to free chlorine for a short period each spring. TTHMs 55 ppb highest locational running annual average (range 22–68). HAA5 35 ppb (range 13–55). Kitchen shopping stays the Cloud RO / Waterdrop path already used on other cities if a listing is why you are looking.
Sources
- 2025 Drinking Water Quality Report (2024 data) — DC Water. Accessed 2026-09-09.
Updated September 9, 2026. A city file is chemistry we can cite plus the sewer rule. No invented detections.